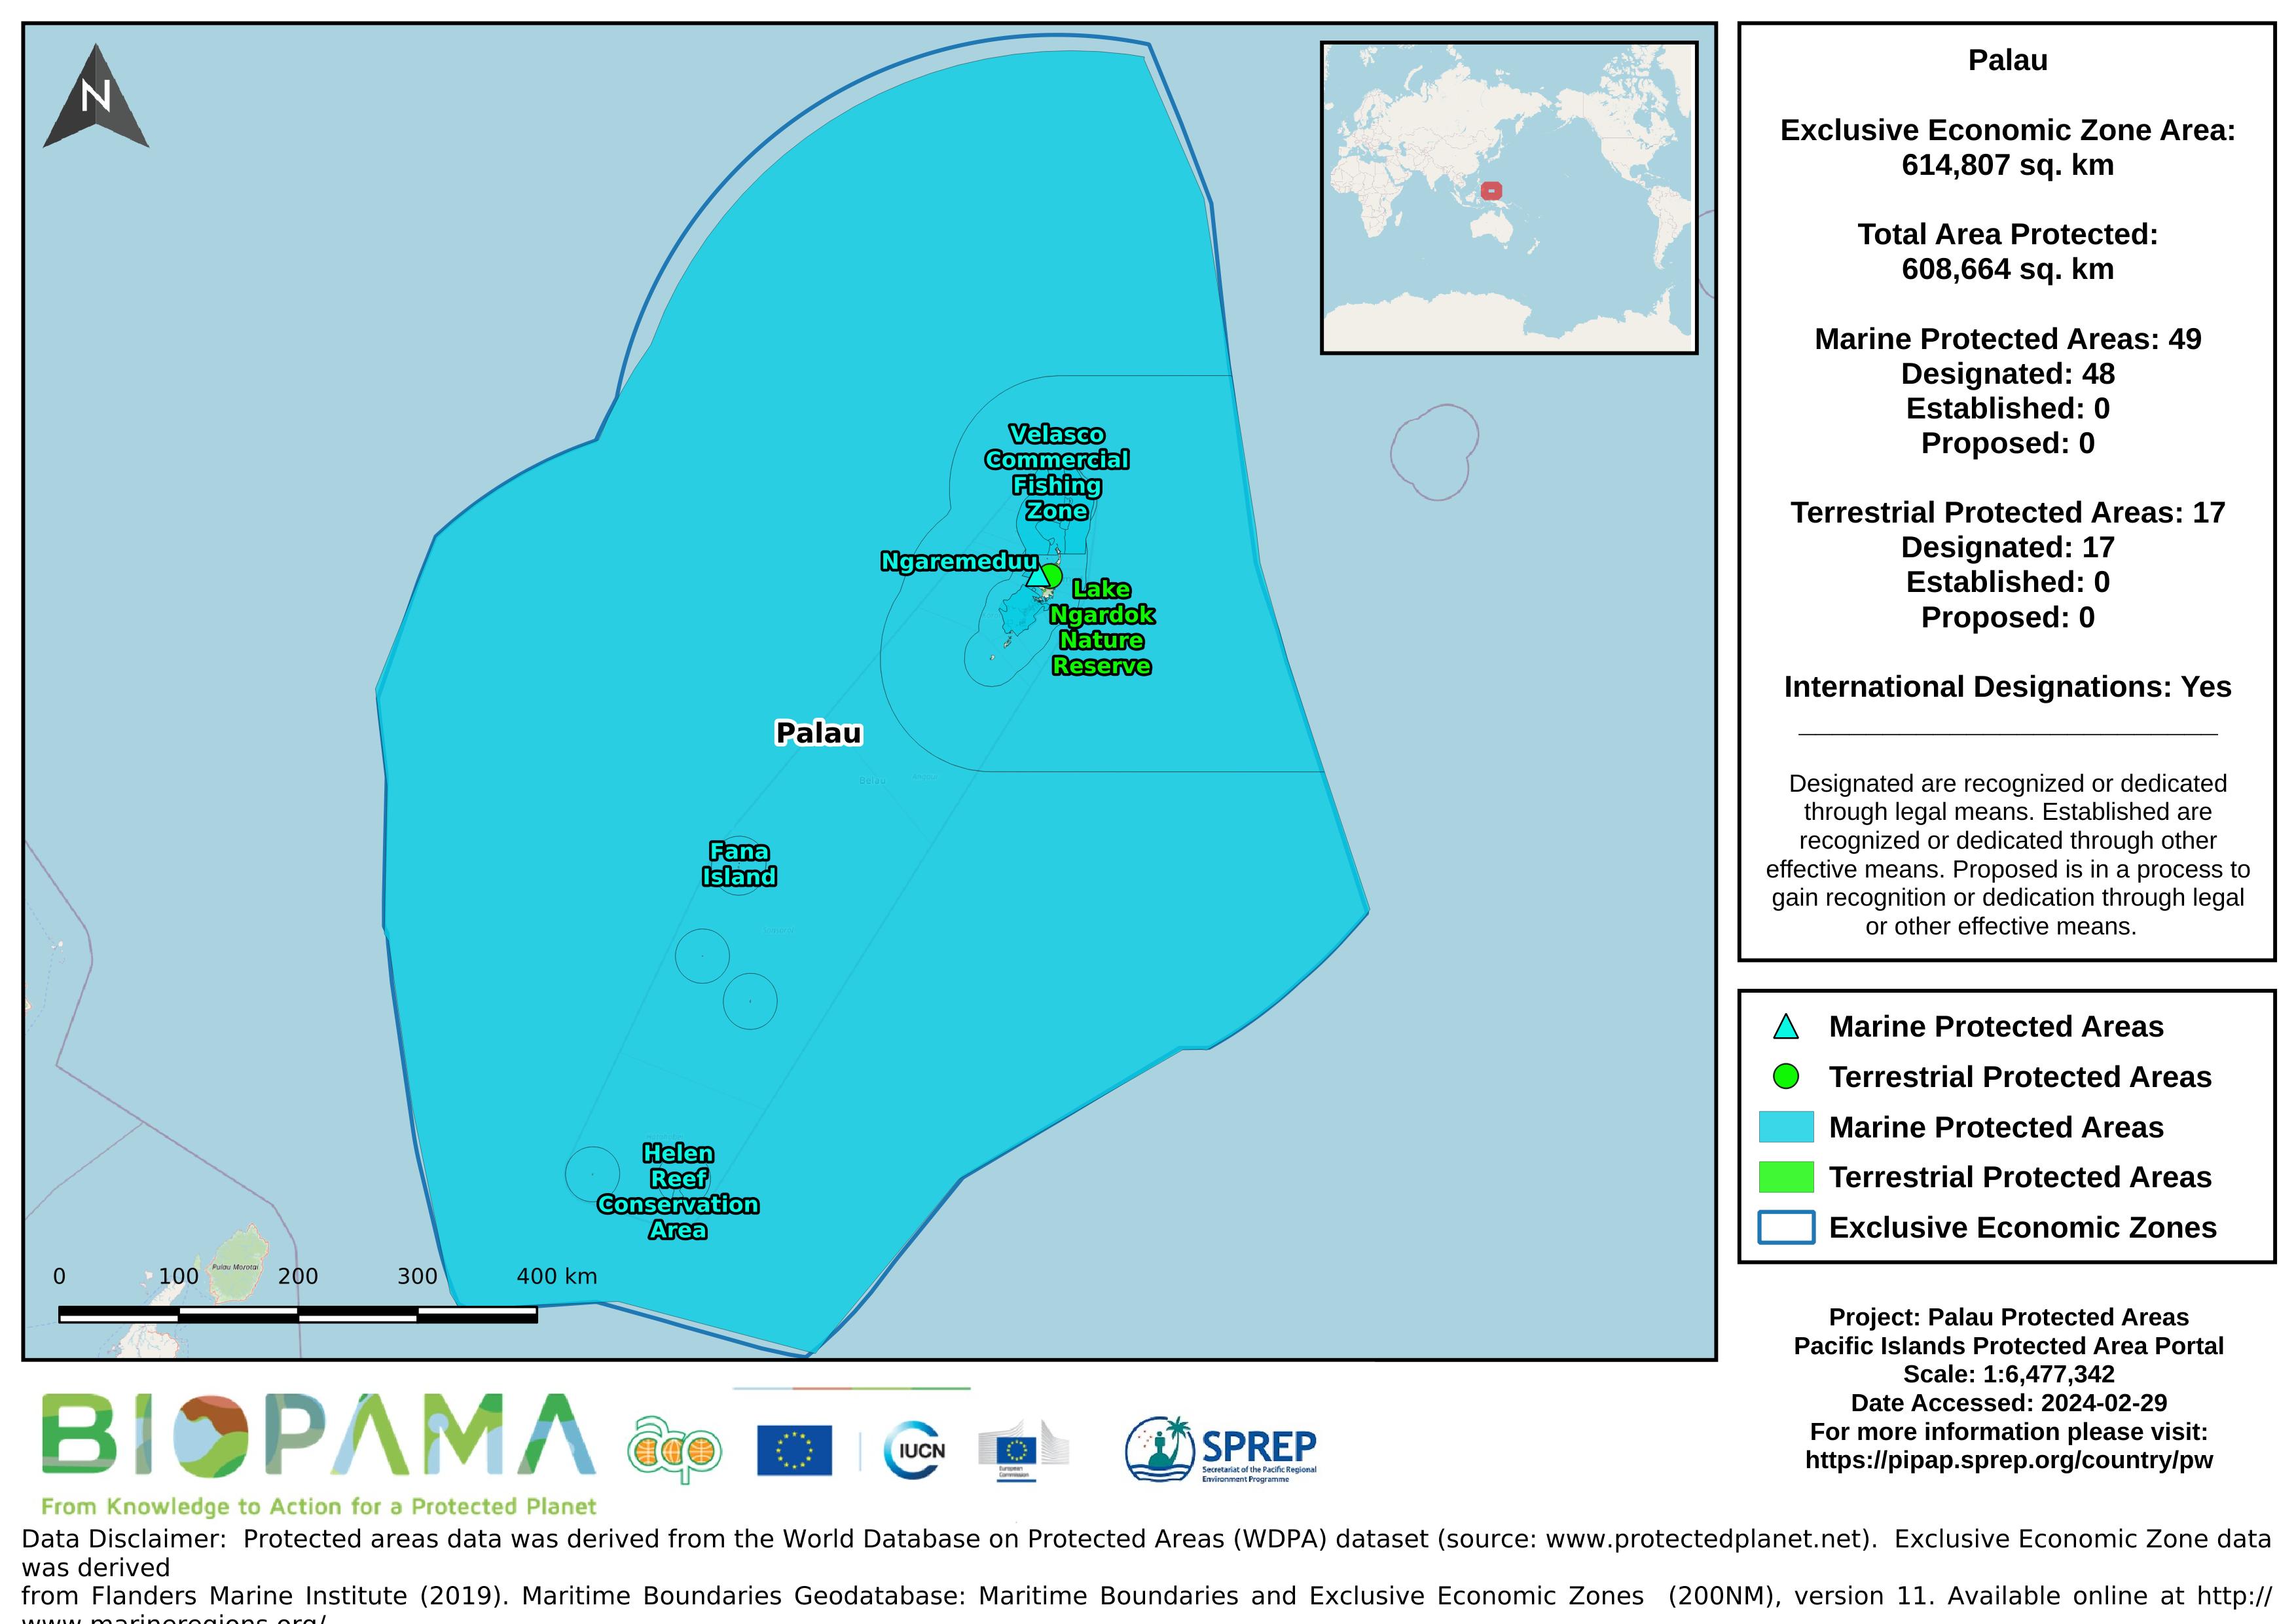
Map of the protected areas for Palau with country-level summary statistics on the amount of area under protection, count for each type of protected area (terrestrial or marine), and the count of their designation.
Map of the protected areas for Palau Island with country-level summary statistics on the amount of area under protection, count for each type of protected area (terrestrial or marine), and the count of their designation.
the link directly leads to the Republic of Palau's data on the Micronesia Challenge website
Dataset that provides a direct internet link to Palau's climate change data portal.
direct link to Palau's data on the GBIF website
Raster data representing the mean levels of calcite in µmol/m3 for the surface water layer. The data are available for global-scale applications at a spatial resolution of 5 arcmin (approximately 9.2 km at the equator).
Marine data layers for present conditions were produced with climate data describing monthly averages for the period 2000–2014, obtained from pre-processed global ocean re-analyses combining satellite and in situ observations at regular two- and three-dimensional spatial grids.
Raster data representing the mean levels of current velocities in meters/second for the surface water layer. The data are available for global-scale applications at a spatial resolution of 5 arcmin (approximately 9.2 km at the equator).
Marine data layers for present conditions were produced with climate data describing monthly averages for the period 2000–2014, obtained from pre-processed global ocean re-analyses combining satellite and in situ observations at regular two- and three-dimensional spatial grids.
Raster data representing the mean levels of iron in µmol/m3 for the surface water layer. The data are available for global-scale applications at a spatial resolution of 5 arcmin (approximately 9.2 km at the equator).
Marine data layers for present conditions were produced with climate data describing monthly averages for the period 2000–2014, obtained from pre-processed global ocean re-analyses combining satellite and in situ observations at regular two- and three-dimensional spatial grids.
Raster data representing the mean levels of pH for the surface water layer. The data are available for global-scale applications at a spatial resolution of 5 arcmin (approximately 9.2 km at the equator).
Marine data layers for present conditions were produced with climate data describing monthly averages for the period 2000–2014, obtained from pre-processed global ocean re-analyses combining satellite and in situ observations at regular two- and three-dimensional spatial grids.
Raster data representing the mean levels of photosynthetically active radiation (PAR) in E/m2/year for the surface water layer. The data are available for global-scale applications at a spatial resolution of 5 arcmin (approximately 9.2 km at the equator).
Marine data layers for present conditions were produced with climate data describing monthly averages for the period 2000–2014, obtained from pre-processed global ocean re-analyses combining satellite and in situ observations at regular two- and three-dimensional spatial grids.
From the Turtle Research and Monitoring Database System (TREDS)
From the Turtle Research and Monitoring Database System (TREDS)
From the Turtle Research and Monitoring Database System (TREDS)
From the Turtle Research and Monitoring Database System (TREDS)
From the Turtle Research and Monitoring Database System (TREDS)
From the Turtle Research and Monitoring Database System (TREDS)
The SPREP ID map is a high resolution (1MB) that shows SPREP member countries with their Exclusive Economic Zone (EEZ) boundaries developed by the GIS team at SPREP.
The SPREP ID map is low resolution (200KB) that shows SPREP member countries with their Exclusive Economic Zone (EEZ) boundaries developed by the GIS team at SPREP.
The map is high resolution showing SPREP member countries' Exclusive Economic Zone (EEZ) boundaries overlaid on a bathymetric base layer that was developed by the GIS team at SPREP.
The map is low resolution showing SPREP member countries' Exclusive Economic Zone (EEZ) boundaries overlaid on a bathymetric base layer that was developed by the GIS team at SPREP.