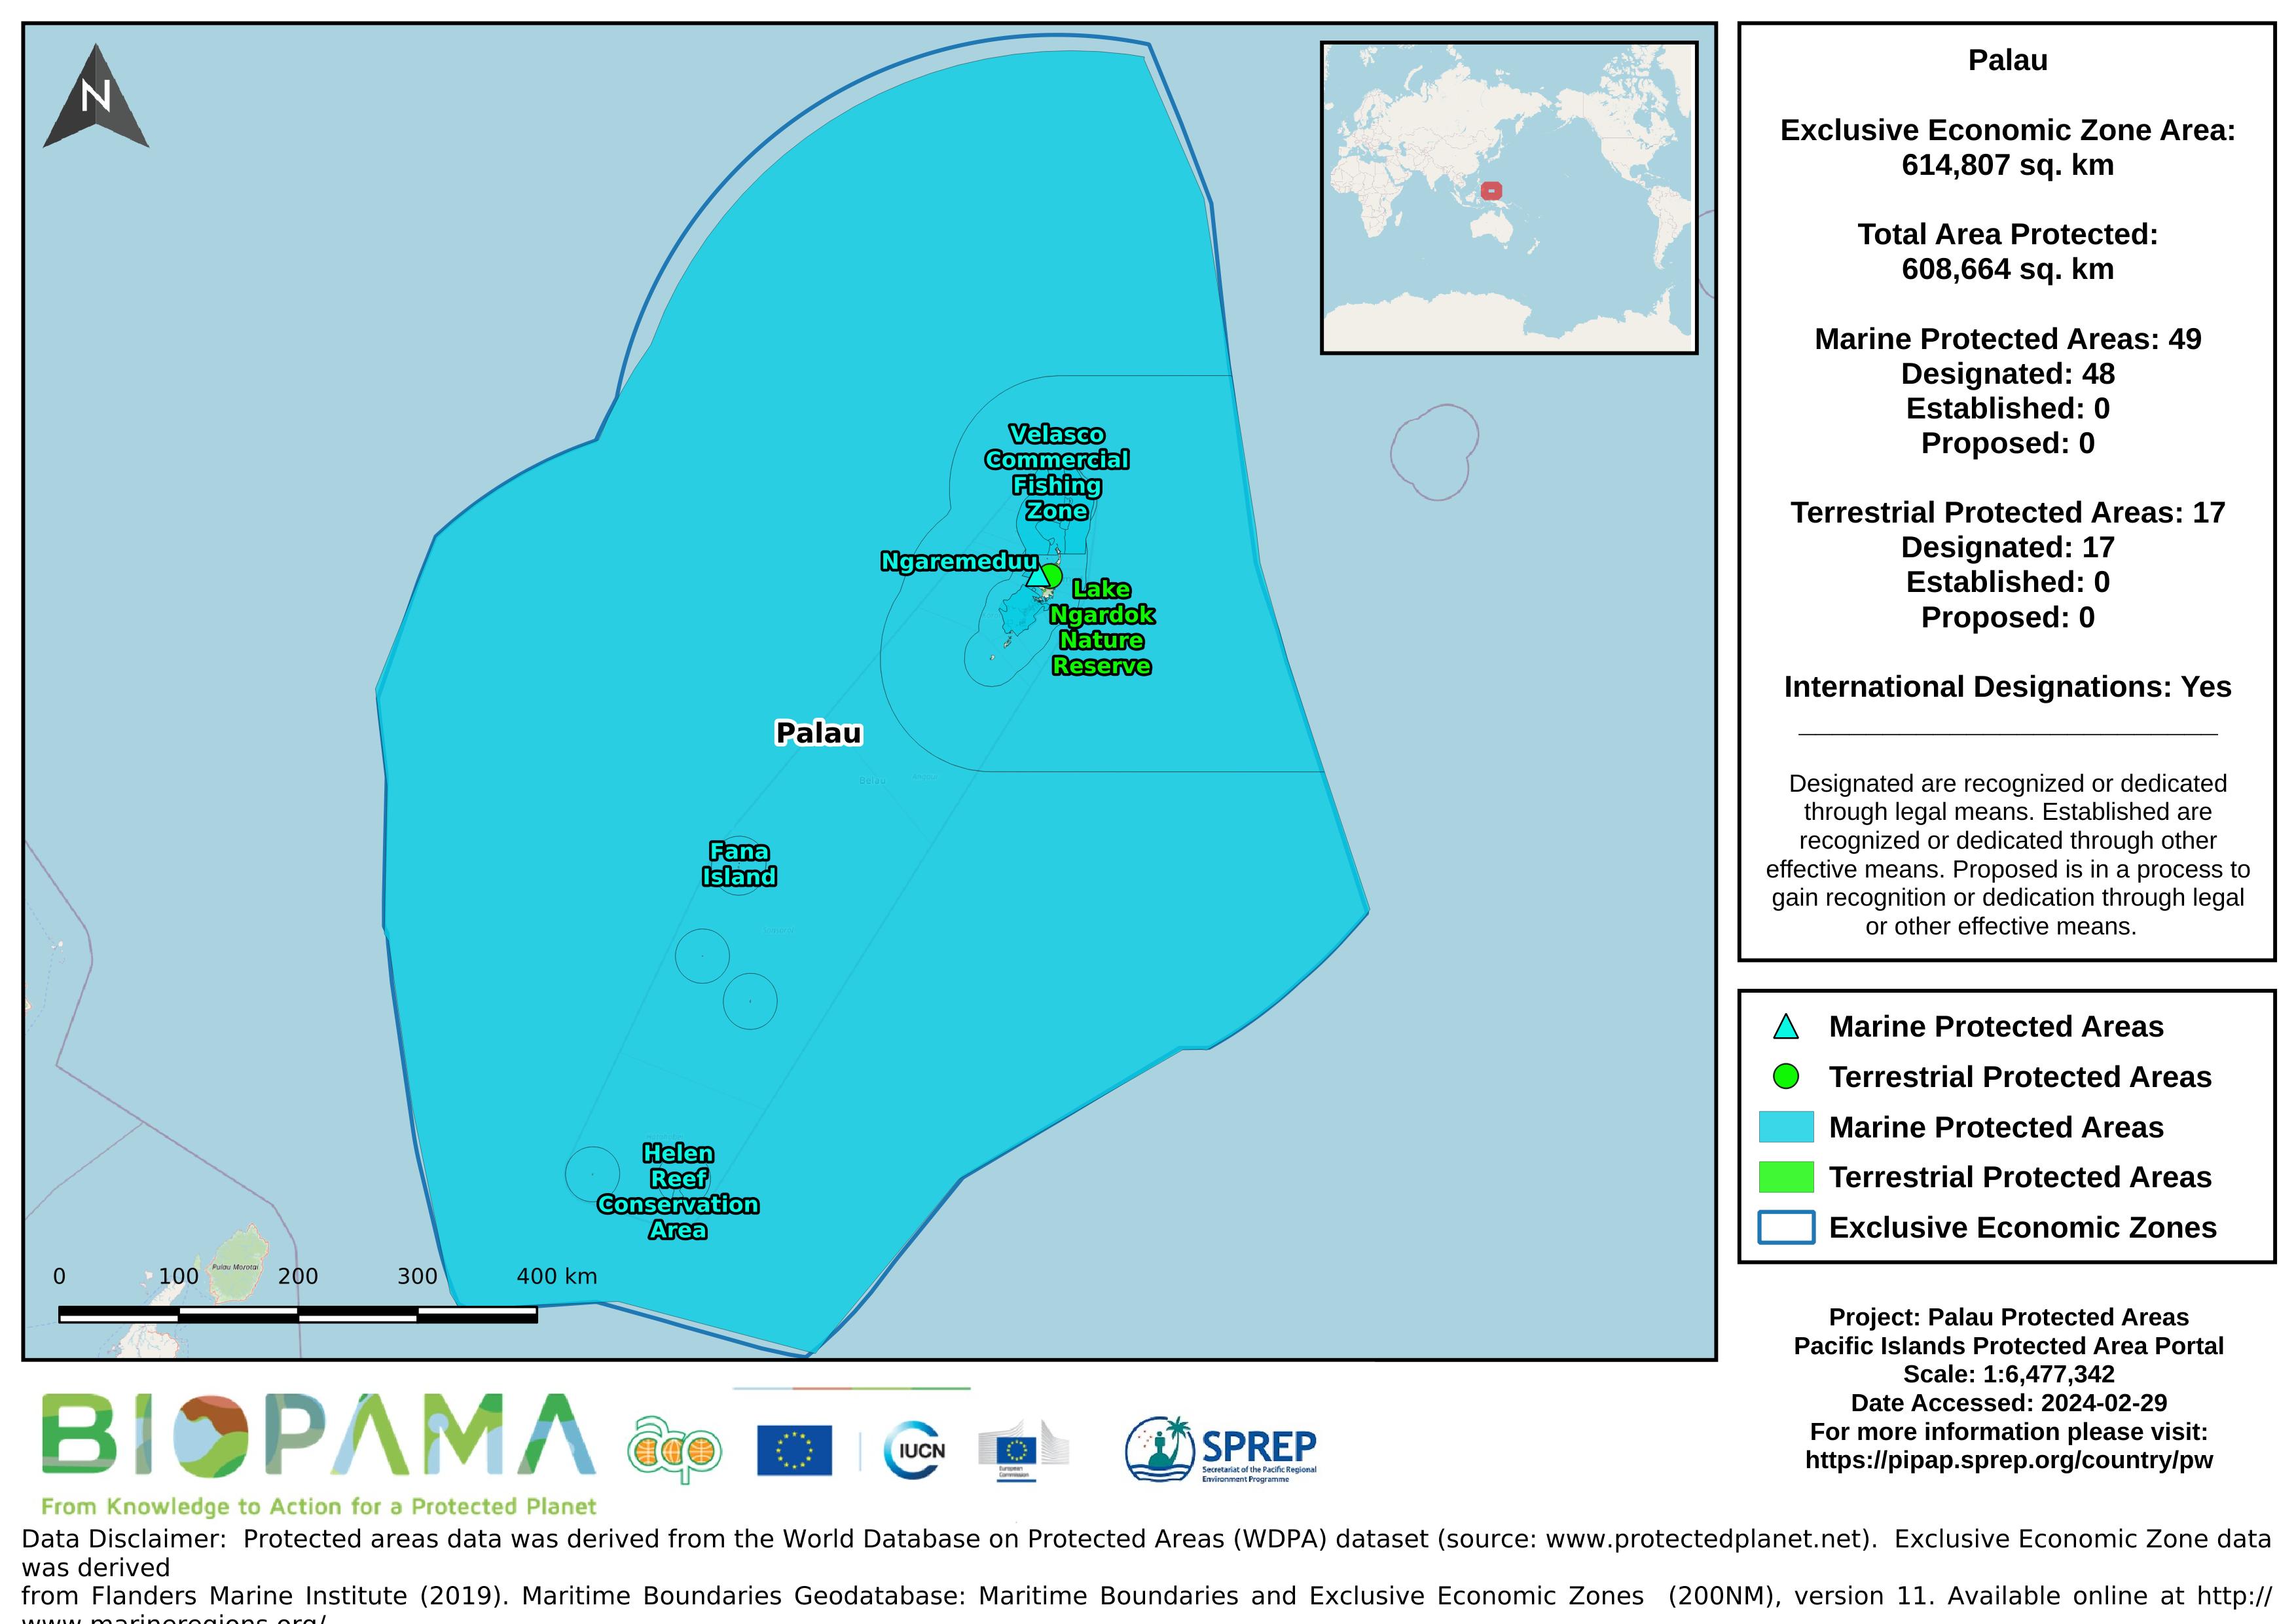
Map of the protected areas for Palau with country-level summary statistics on the amount of area under protection, count for each type of protected area (terrestrial or marine), and the count of their designation.
Map of the protected areas for Palau Island with country-level summary statistics on the amount of area under protection, count for each type of protected area (terrestrial or marine), and the count of their designation.
CSV file containing the global distribution of hydrothermal vent fields in WGS84 coordinate system.
Historical rainfall data Palau (1901-2015). Climate Change Knowledge Portal, World Bank Group.
CSV file containing species richness values and mapping parameters for marine species (with a probability of occurrence > 0.5) derived from AquaMaps. A total of 33,512 species were used in the generation of this file.
Coordinate system is WGS84 (ESPG 4326) with coordinates expressed in longitude and latitude.
Fields in this file are:
C-Square Code: unique identifier for grid
Longitude: longitude in decimal degrees
Latitude: latitude in decimal degrees
Species Count: number of species modeled at given point
From the Turtle Research and Monitoring Database System (TREDS)
From the Turtle Research and Monitoring Database System (TREDS)
From the Turtle Research and Monitoring Database System (TREDS)
From the Turtle Research and Monitoring Database System (TREDS)
From the Turtle Research and Monitoring Database System (TREDS)
From the Turtle Research and Monitoring Database System (TREDS)
The SPREP ID map is a high resolution (1MB) that shows SPREP member countries with their Exclusive Economic Zone (EEZ) boundaries developed by the GIS team at SPREP.
The SPREP ID map is low resolution (200KB) that shows SPREP member countries with their Exclusive Economic Zone (EEZ) boundaries developed by the GIS team at SPREP.
The map is high resolution showing SPREP member countries' Exclusive Economic Zone (EEZ) boundaries overlaid on a bathymetric base layer that was developed by the GIS team at SPREP.
The map is low resolution showing SPREP member countries' Exclusive Economic Zone (EEZ) boundaries overlaid on a bathymetric base layer that was developed by the GIS team at SPREP.
FAOSTAT population data download 31/07/2018
Each value represents the number of dumping events observed on fishing vessels during the period 2003-2015
a mapping representation of active and passive continental margins, oceanic plate boundaries and mid ocean spreading ridges